Ceto Data Management Platform
A centralized online tool for collecting and managing marine mammal health and stranding data
Summary
Role: Lead Product Designer
Timeline: 1.5 years
Team: project manager, fullstack developer, backend developer, designer, subject matter experts from the National Oceanic and Atmospheric Association (NOAA) and National Fish and Wildlife Foundation (NFWF)
Responsibilities: Led product strategy, UX, information architecture, interaction model, and design system for a greenfield enterprise platform. Partnered with NOAA subject matter experts, engineering, and project leadership to translate complex regulatory workflows into a scalable product used across a national network of rehabilitation organizations.
Challenge: NOAA’s Level A form collects marine mammal stranding events. It had evolved over decades into a dense reporting artifact that encoded regulatory requirements, scientific protocols, and organizational workflows. Replacing the form wasn't simply a digitization effort—it required translating implicit domain knowledge into a scalable product while preserving data integrity and enabling nationwide adoption.
Outcome:
Fully functioning centralized data management platform to replace the Level A form
Learnings to inform future phases/additional features
The problem
The Level A form wasn't simply difficult to complete. It served simultaneously as a regulatory document, scientific dataset, operational workflow, and historical archive.
Every error required NOAA staff to manually reconcile records, delaying research and increasing administrative costs. The challenge wasn't digitizing paperwork. It was designing a platform capable of supporting multiple user types while improving data quality without increasing reporting burden.
Product strategy
Prioritization: Given the team's limited engineering capacity, I worked with stakeholders to separate "required for launch" functionality from enhancements that could be introduced in later phases. This allowed us to deliver a usable platform while maintaining long-term product direction.
Tradeoffs: We had to preserve almost every field from the paper form. Rather than exposing all information simultaneously, I reorganized questions into logical sections and surfaced only information relevant to each reporting scenario to reduce cognitive load and streamline collection.
Different rehabilitation organizations had slightly different reporting practices. Instead of designing organization-specific experiences, I developed reusable interaction patterns that accommodated variation while maintaining a consistent platform.
Stakeholder alignment: I served as the bridge between domain experts and engineering, converting complex regulatory workflows into product requirements that both groups could understand and execute against.
Roadmap decisions: Because the platform was intended to replace a decades-old process, immediate feature completeness was less important than establishing a scalable foundation. Early roadmap decisions emphasized reusable infrastructure that could support future forms, document management, and reporting capabilities.
Discovery revealed opportunities far beyond the initial reporting workflow. Rather than expanding scope, we documented these opportunities and intentionally sequenced them into future phases to maintain delivery momentum.
Understanding the system
Before designing interfaces, I invested in understanding the underlying system. Over several months of discovery, I worked with NOAA subject matter experts to map hundreds of conditional rules, dependencies, and reporting pathways embedded in the legacy paper process. These system maps became the shared source of truth for product strategy, engineering implementation, and stakeholder alignment, allowing the team to replace a decades-old workflow with a scalable platform rather than a digital replica of a paper form.
To visualize the complexity of the Level A form and all the logic it entails, below is the PDF form and a zoomed out flow diagram that maps out only 1 component of the INITIAL OBSERVATION section at the beginning of the form.
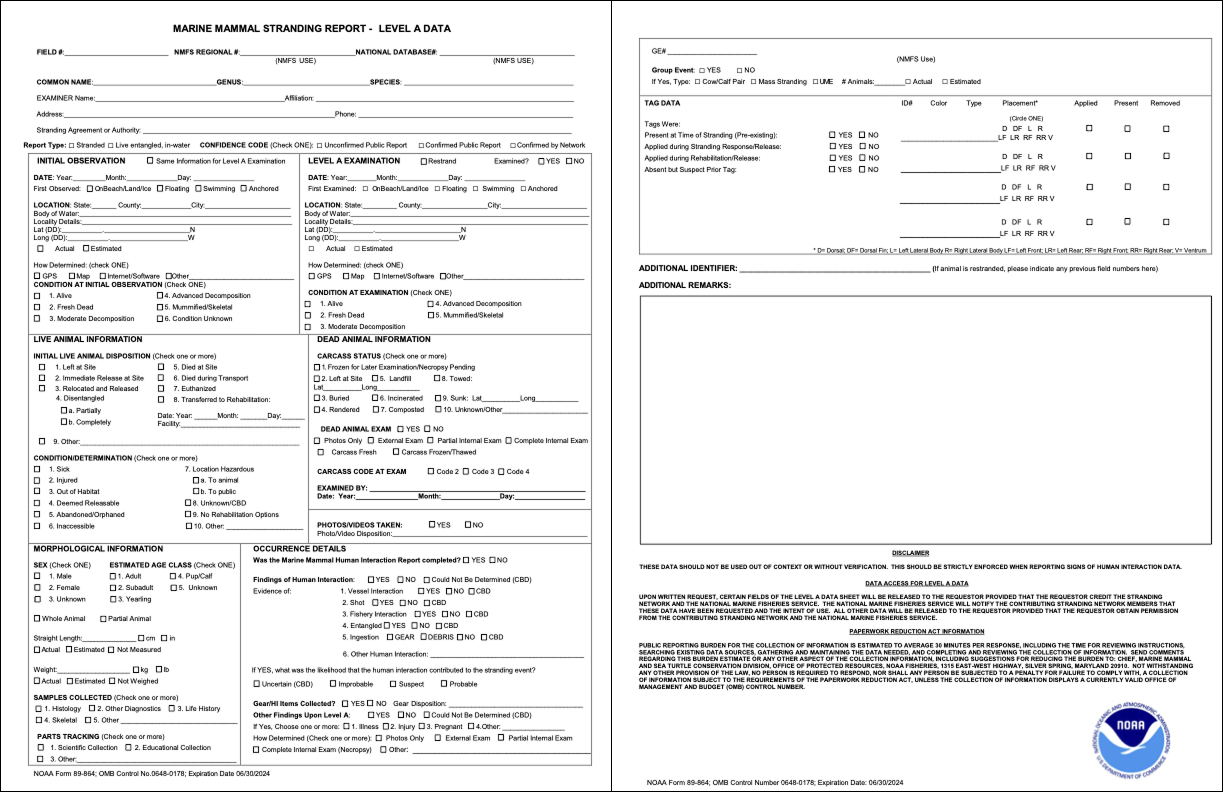
Level A form
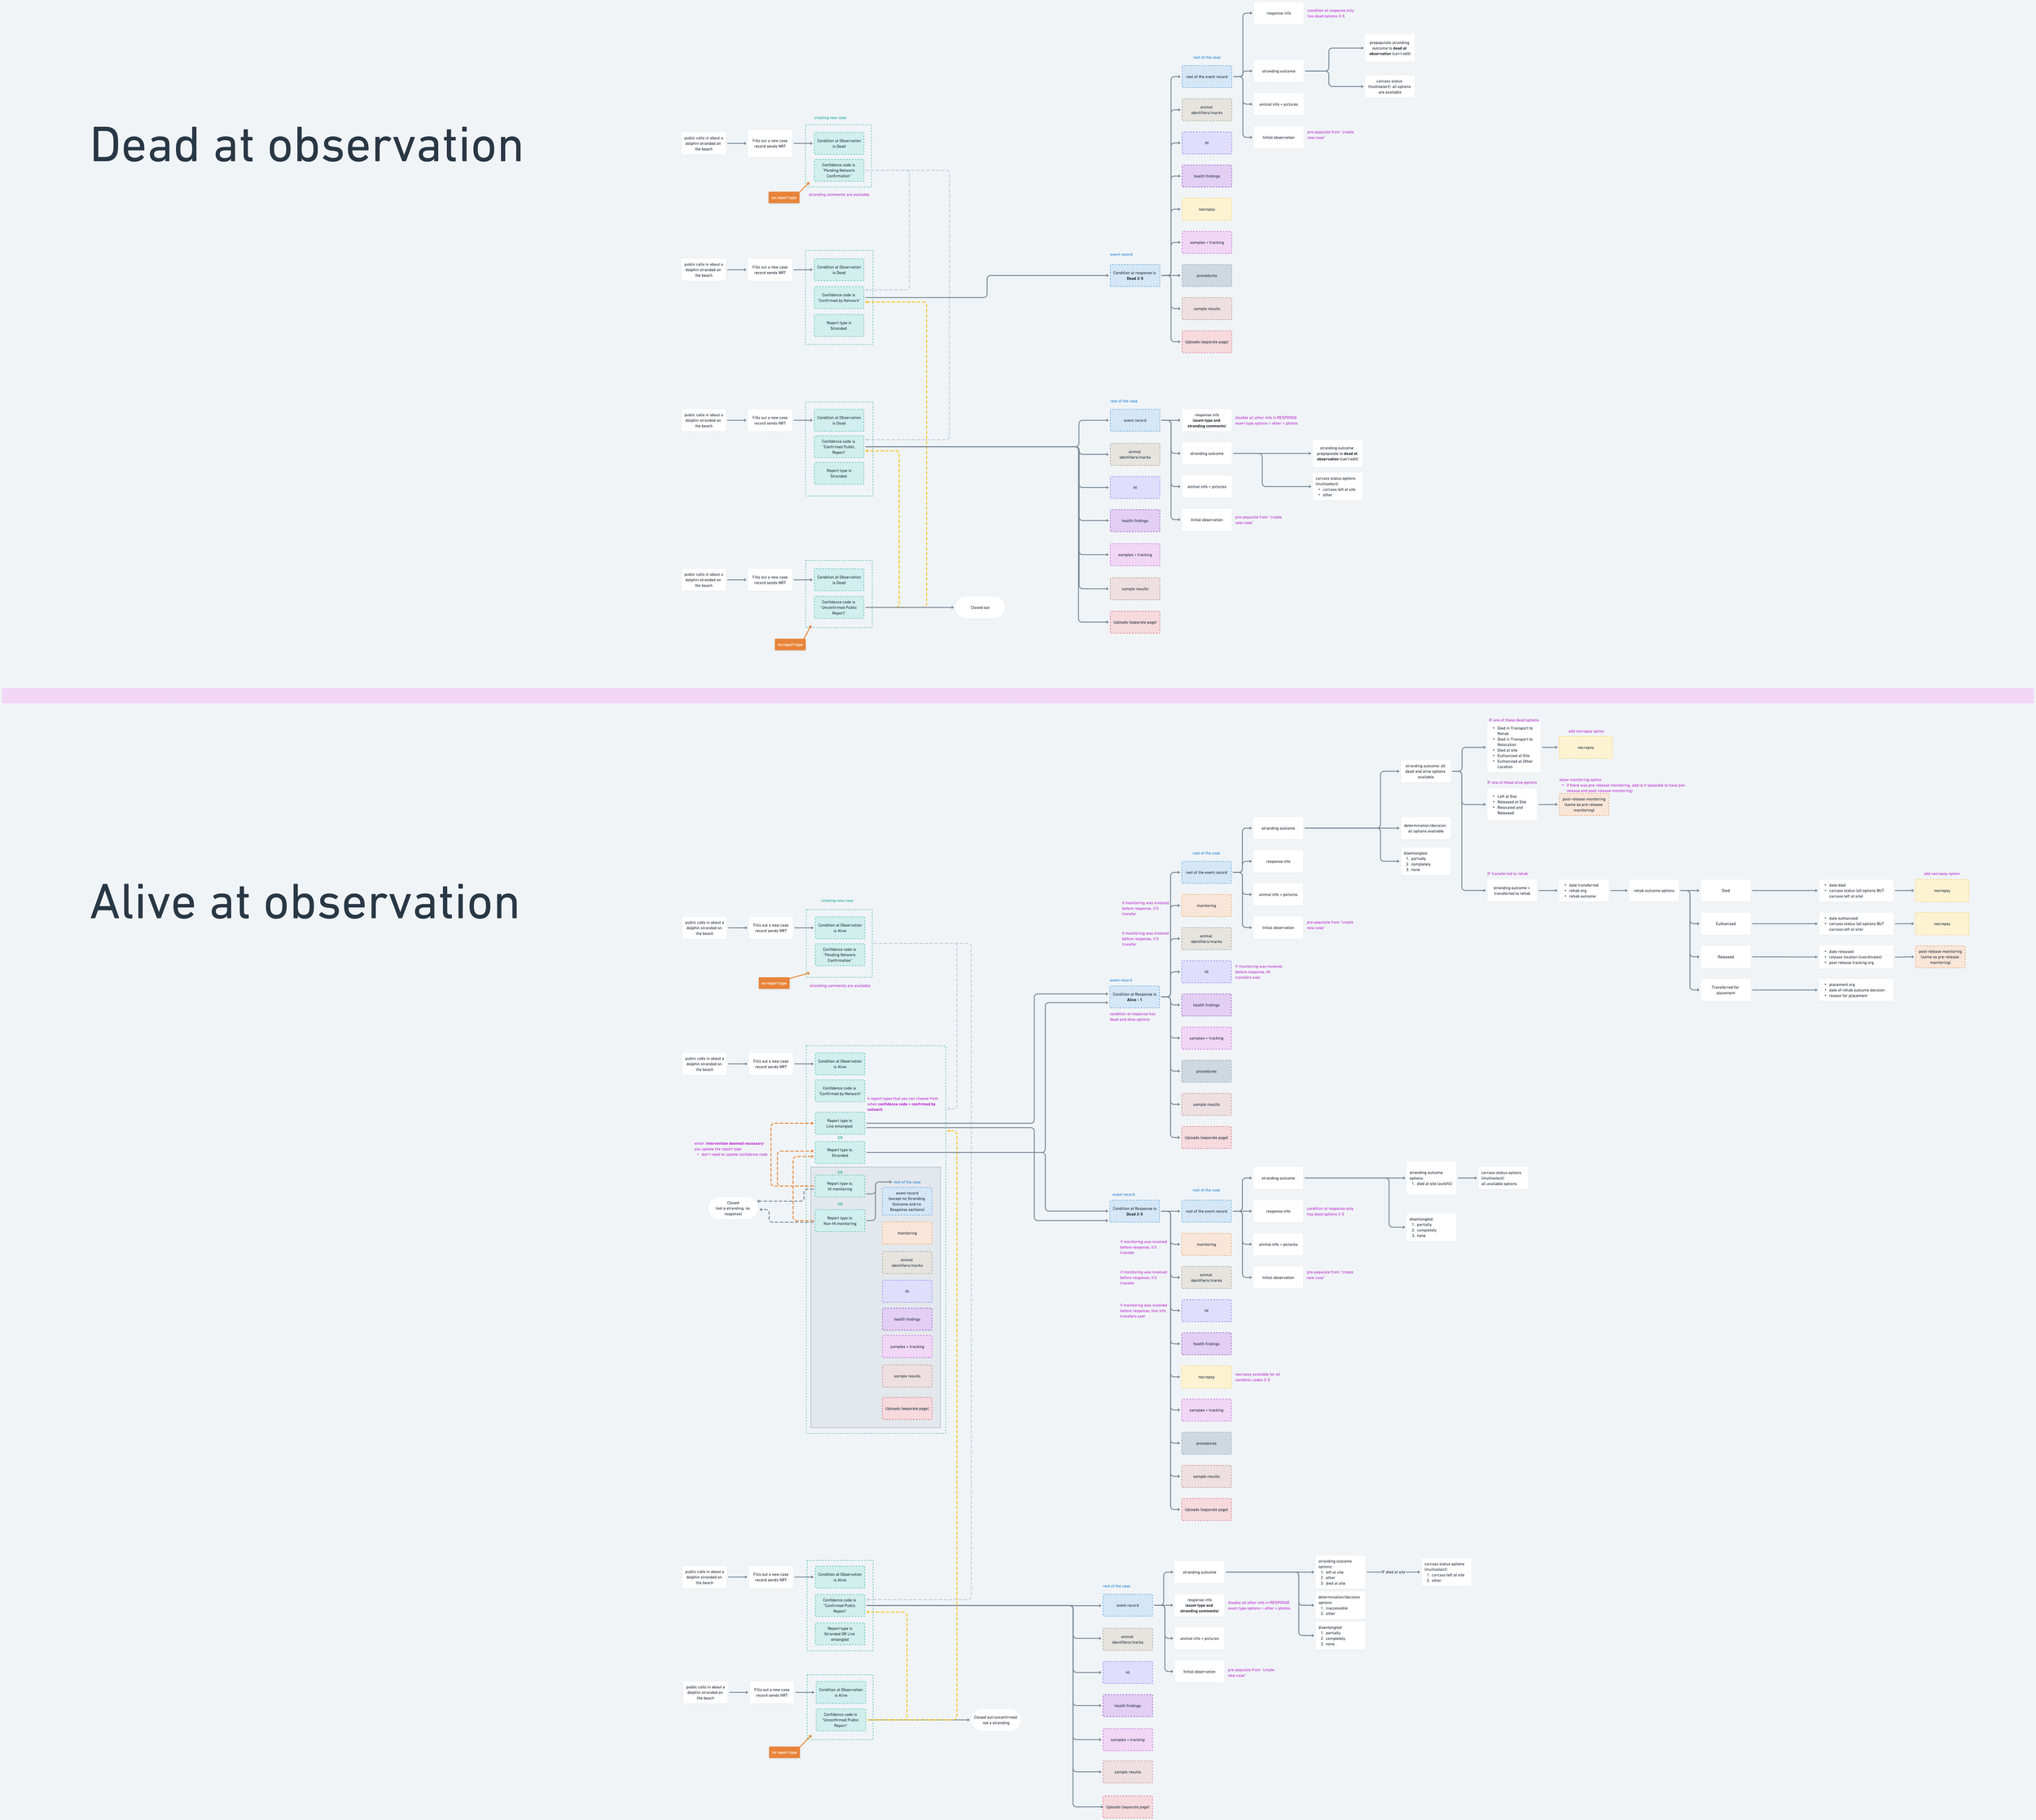
Flow diagram for CONDITION AT INITIAL OBSERVATION
The Level A form contained hundreds of conditional dependencies that had accumulated over decades. Documenting this logic using several separate flow diagrams just like the above exposed duplicated paths, contradictory requirements, opportunities to automate validation, and reusable workflow patterns. This systems model became the shared blueprint for design, engineering, and NOAA and NFWF stakeholders throughout development.
Design
Designing the information architecture: The paper process organized information according to how it was historically documented, not how responders actually worked. I reorganized the experience around the natural progression of a case—from intake to observation, examination, documentation, and reporting—making information easier to find while preserving NOAA's data requirements.
No more static forms: Dynamic workflows was crucial to the overall experience. The platform needed to behave differently depending on the reported animal, condition, and event details. Customized logic reduced visual complexity while ensuring NOAA still collected complete datasets.
Reusable interaction patterns: Because the platform would most likely continue expanding after launch, I established reusable patterns rather than one-off solutions. Rather than optimizing individual screens, I focused on interaction patterns that engineering could reuse across future modules, such as navigational components, document previews, tables, and validation. This reduced implementation effort, created consistency for users, and established a foundation for future platform growth.
Error prevention as a product strategy: Since one of NOAA's biggest operational pain points was correcting incomplete or inconsistent reports after submission, improving organizational data quality was a main goal. This included inline validation, conditional inputs, required fields, review screens, and confirmations.
Designing for future expansion: While the initial release focused on digitizing the Level A reporting workflow, I intentionally designed the navigation, interaction patterns, and data model to accommodate future modules, such as additional reporting forms and expanded case management capabilities.
The Ceto platform showing case management, document management, auto-generated reports, and verification.
Key results
Enabled phased migration away from paper reporting across a national network of organizations.
Reduced manual data validation through dynamic logic and automated verification.
Created structured data suitable for downstream scientific analysis.
Established reusable platform patterns for future modules beyond the initial reporting workflow.
Secured continued investment and additional phases following successful launch.
Reflection
This was a huge step in digitizing old, tedious manual work at NOAA that was prone to errors, which wasted a lot of time and manual work to correct. This was like a very large pilot project that proved to NOAA that old paper processes could (and should) be digitized successfully. After launch, the team impressed NOAA and NFWF so much that we were contracted to add and digitize more functionality and features within the next few years. Ceto transformed a highly manual, error-prone government workflow into a scalable digital system designed for long-term scientific research, regulatory reporting, and operational decision making.
Personal reflection:
This project fundamentally changed how I approach enterprise product design. I learned that the hardest problems aren't interface problems—they're organizational problems. Success depended less on designing individual screens and more on creating shared understanding across domain experts, engineering, and product stakeholders. By modeling the underlying system before designing interfaces, we reduced implementation ambiguity, accelerated engineering conversations, and created a platform that could continue evolving long after the initial release.